Watch Revenue & Pipeline Metrics
Unleash the power of data visualization and gain a panoramic view of your revenue landscape like never before.
- Track a comprehensive set of RevOps metrics with RevenUp’s cross-functional dashboards.
- Empower your Revenue Operations teams to delve into operational data effortlessly across siloed sources without the need for manual analysis.
- Unveil hidden patterns and forecast revenue underperformance based on early warning signals and take action before it impacts your top line.
- Unveil hidden patterns and forecast revenue underperformance based on early warning signals and take action before it impacts your top line.


Cross-functional Data Models
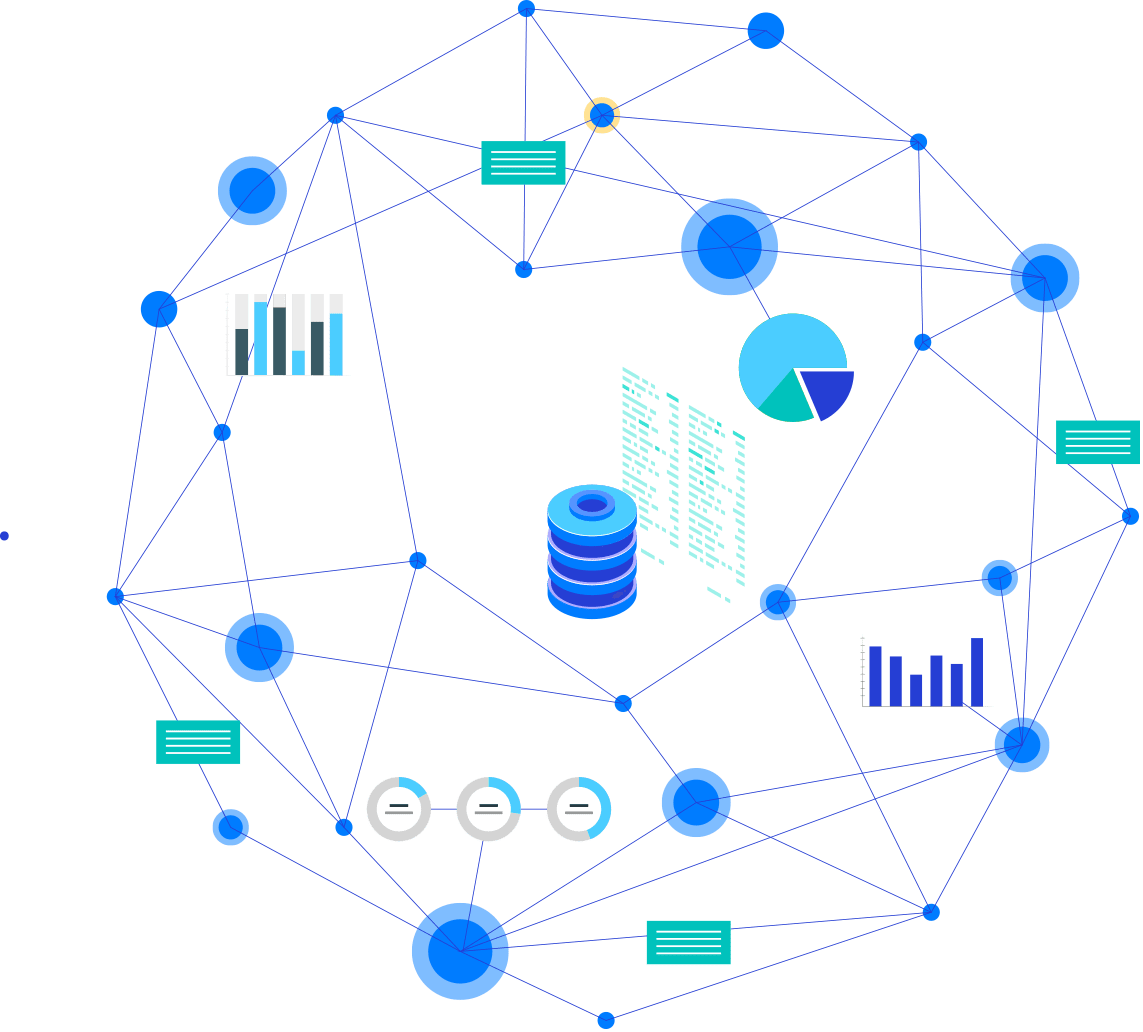
Consolidate data from every revenue-critical department, including marketing, sales, customer success, and more, into a unified platform. No more data siloes – you get a comprehensive, real-time view of your organization’s revenue performance.
Interactive Visualizations
Immerse yourself in captivating interactive charts and tables – our cross-functional dashboards highlight specific stages of your customer journey or operational processes that could be hindering revenue growth. Explore your revenue data with ease, apply filters, and drill down into the raw data as necessary.


Unveil Hidden Patterns
RevenUp’s advanced algorithms are designed to uncover the most elusive patterns and trends lurking within your revenue data. Leverage actionable insights from the dashboards to zero in on revenue leak hotspots with precision. Take action on upstream indicators of underperformance before it impacts revenue.


